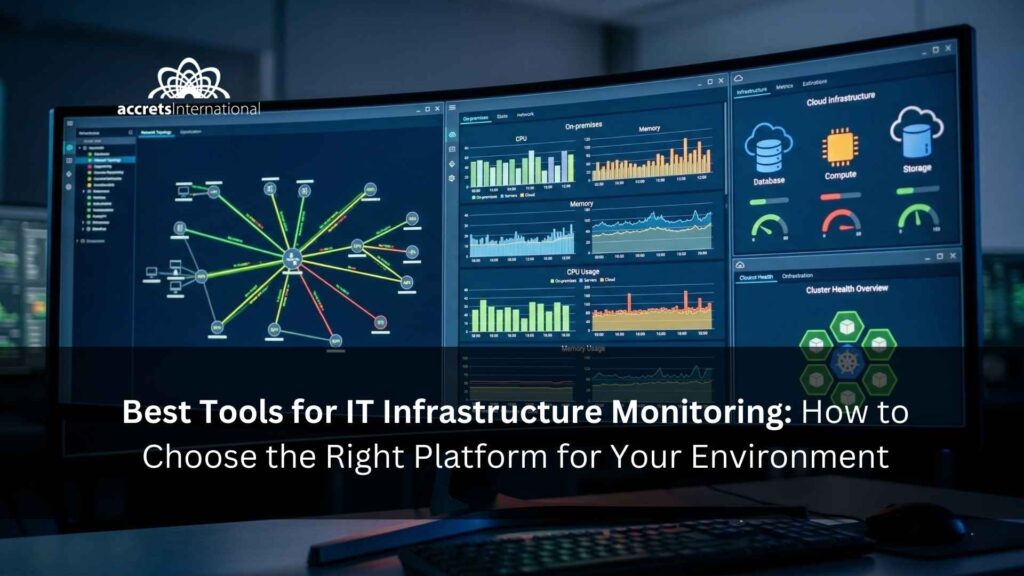

If you are searching for the best tools for IT infrastructure monitoring, the short answer is this: the right platform depends on your environment, your team’s technical depth, and how much visibility, automation, and scalability you need.
Some tools are better for cloud-first enterprises, some are stronger for hybrid infrastructure, and others are ideal for open-source flexibility or Kubernetes-heavy environments. In this guide, we will walk through the best options together, explain where each one fits, and help you narrow down the right choice before you invest time or budget in the wrong platform.
TL;DR
- Datadog is a strong choice for cloud-first enterprises that want fast deployment and broad integrations.
- Zabbix is one of the best open-source options for teams that want flexibility and control.
- PRTG works well for midsize environments that need straightforward all-in-one monitoring.
- LogicMonitor is well suited for hybrid infrastructure at scale.
- SolarWinds remains a practical option for traditional enterprise IT operations.
- New Relic fits teams that want infrastructure monitoring and observability in one platform.
- Prometheus + Grafana is ideal for Kubernetes-heavy and engineering-led environments.
- Dynatrace stands out for AI-assisted root cause analysis and automation.
- The best tool is the one that matches your infrastructure model, operational maturity, and long-term cost expectations.
Choosing the best tool for IT infrastructure monitoring is harder than it looks. Most platforms promise full visibility, smarter alerts, faster root cause analysis, and seamless scaling. In practice, the right choice depends on your environment, your team’s skills, and how much operational complexity you are willing to manage.
For most IT leaders, the real goal is not just more monitoring. It is fewer blind spots, faster incident response, better capacity planning, and a monitoring stack that still works as the infrastructure grows across on-prem systems, cloud workloads, containers, and hybrid environments. That is especially true if your business is already modernizing infrastructure, expanding into Southeast Asia, or aligning monitoring with broader cloud and resilience goals.
This guide compares the best IT infrastructure monitoring tools, explains where each one fits best, and shows how to choose without getting lost in category overlap.
The Best IT Infrastructure Monitoring Tools at a Glance
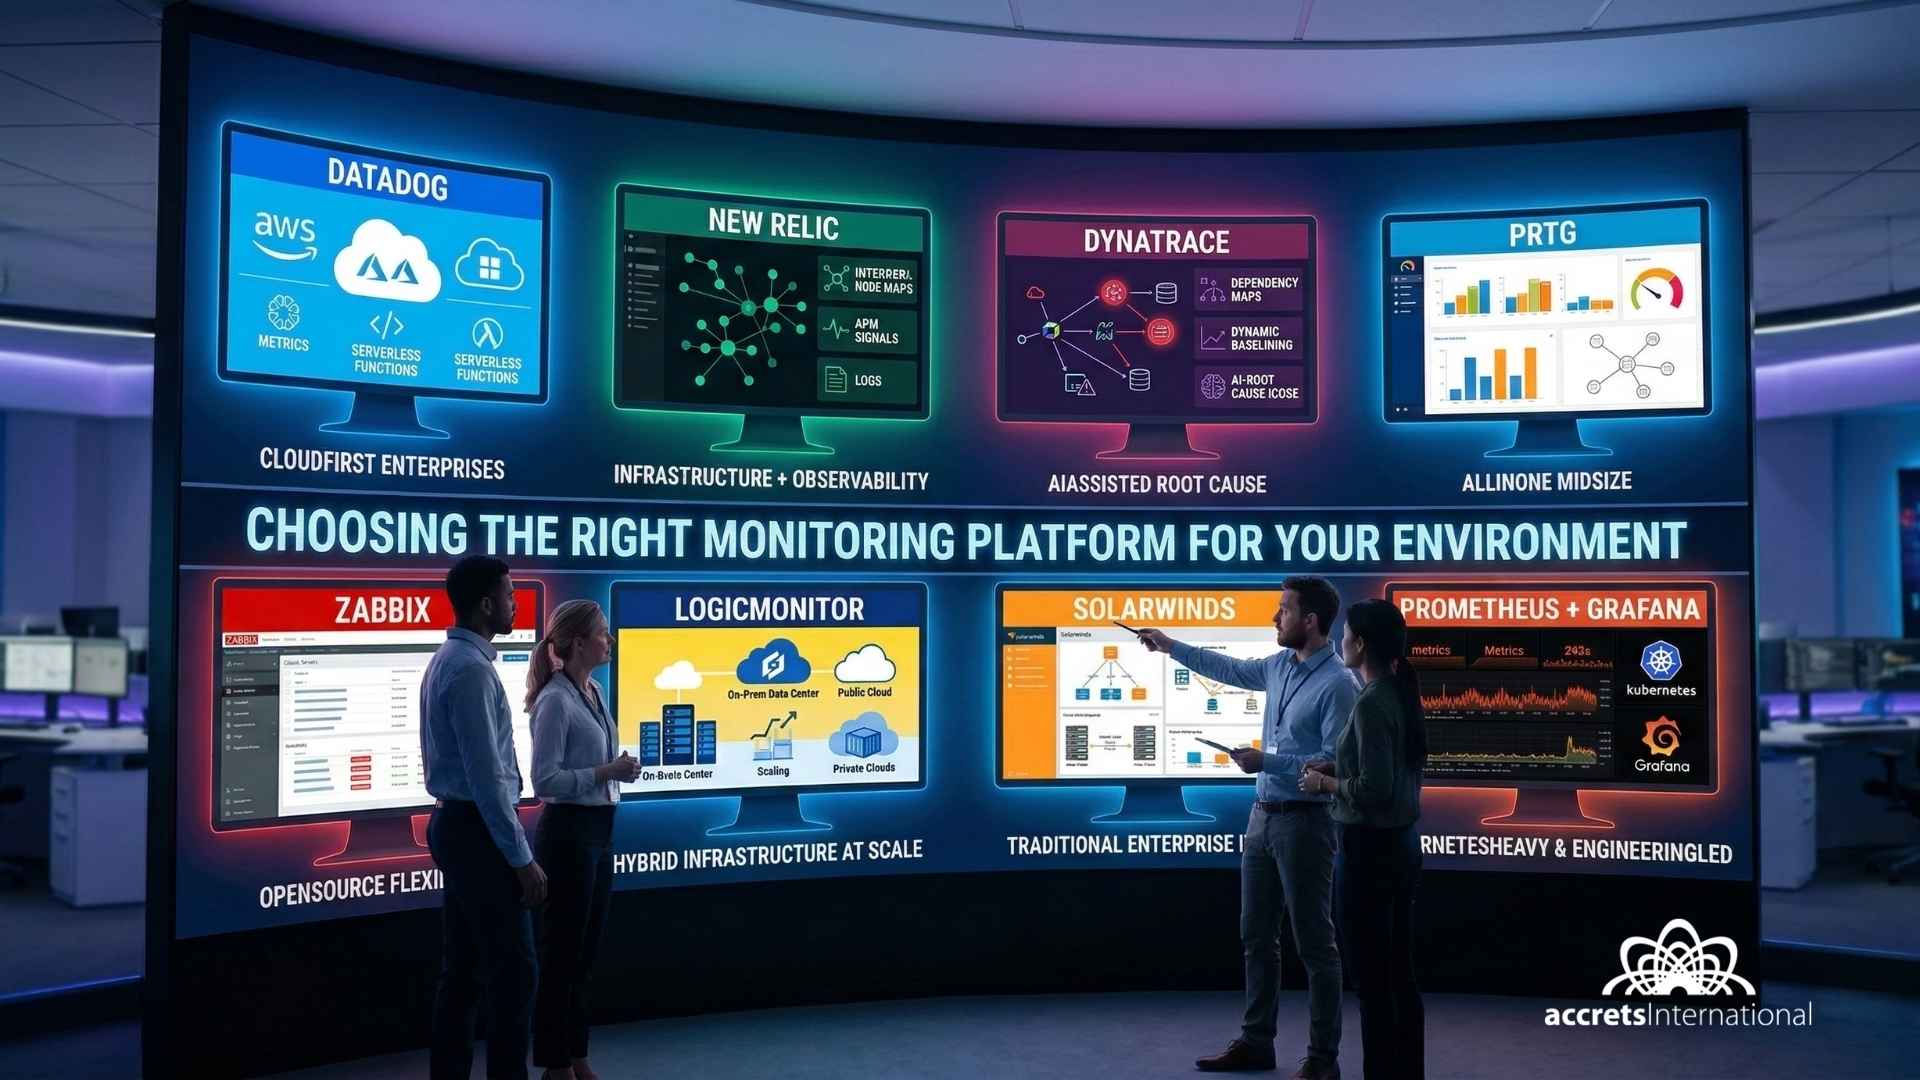
If you want the fast answer, these are the platforms most teams end up shortlisting:
- Datadog: best for cloud-first enterprises that want broad visibility and fast deployment
- Zabbix: best open-source option for teams that want flexibility and control
- PRTG: best for all-in-one monitoring in midsize IT environments
- LogicMonitor: best for hybrid infrastructure at scale
- SolarWinds: best for traditional enterprise IT operations teams
- New Relic: best for teams blending infrastructure monitoring with observability
- Prometheus + Grafana: best for Kubernetes-heavy and engineering-led environments
- Dynatrace: best for advanced automation and AI-assisted troubleshooting
The right choice depends less on brand recognition and more on fit. A cloud-native SaaS business, for example, will usually evaluate tools very differently from a regional enterprise running hybrid infrastructure with strict governance requirements.
What Is IT Infrastructure Monitoring, Exactly?
IT infrastructure monitoring is the practice of tracking the health, performance, and availability of the systems your business depends on. That includes servers, networks, storage, virtual machines, cloud resources, databases, containers, and sometimes the dependencies between them.
This matters because infrastructure is no longer confined to one data center. Many businesses now operate across private cloud, public cloud, virtualized environments, and distributed regional workloads. If you need a broader foundation before evaluating tools, it helps to understand the fundamentals of cloud computing and how modern environments differ from legacy-only architectures.
It is also important not to confuse infrastructure monitoring with nearby categories. Application performance monitoring focuses more on app-level behavior. Observability platforms often go deeper into logs, traces, and telemetry analysis. Synthetic monitoring checks service availability from an outside-in perspective. Infrastructure monitoring is narrower and more operational: it answers whether your environment is healthy, where bottlenecks are forming, and what needs attention before users feel the impact.
Best IT Infrastructure Monitoring Tools by Use Case
Datadog: Best for cloud-first enterprises
Datadog is often the fastest route to broad visibility in modern cloud environments. It works well for teams running workloads across AWS, Azure, Google Cloud, containers, and microservices, especially when they want infrastructure metrics and application signals in one place.
Its biggest advantage is speed to value. Deployment is relatively quick, dashboards are polished, and integrations are extensive. The tradeoff is cost. Datadog can become expensive as environments scale and telemetry volume grows. It is a strong fit for teams that prioritize fast rollout and deep ecosystem coverage, but less ideal for organizations that need highly predictable long-term cost control.
Zabbix: Best open-source option for flexible teams
Zabbix remains a strong choice for organizations that want robust monitoring without committing to high recurring license fees. It is flexible, mature, and widely used across server, network, and infrastructure monitoring use cases.
Its strength is control. Teams can customize extensively and avoid vendor lock-in. The downside is that it often demands more in-house skill, more tuning, and more operational effort than commercial platforms. Zabbix makes sense for technically capable teams that value flexibility and ownership, but it may be a poor fit for businesses that want minimal maintenance overhead.
PRTG: Best for all-in-one visibility in midsize environments
PRTG is well known for giving IT teams a practical, centralized view of networks, servers, bandwidth, and devices without requiring a highly specialized observability practice. It is often attractive to midsize organizations that want one platform to cover a lot of operational ground.
The main advantage is usability. PRTG is usually easier to understand than more engineering-heavy stacks, and it can work well for teams that need infrastructure coverage without overcomplicating the toolchain. Its limitation is that very large or highly dynamic cloud-native environments may find it less flexible than platforms built for distributed modern architectures.
LogicMonitor: Best for hybrid infrastructure at scale
LogicMonitor stands out when the environment spans data centers, public cloud, legacy systems, and modern workloads. It is built for organizations that need infrastructure monitoring across a mixed estate without stitching together too many point tools.
Its strength is hybrid visibility. That makes it relevant for businesses designing multicloud or transitional operating models, especially where visibility has to extend across regions and environments. In situations like that, the broader planning conversation often overlaps with hybrid cloud providers in Singapore for US-based teams and the governance decisions that come with regional infrastructure expansion. LogicMonitor is a strong option for hybrid operations, though some teams may find its cost and implementation effort higher than simpler tools.
SolarWinds: Best for established enterprise IT operations
SolarWinds remains a common choice for enterprises that want mature network and infrastructure monitoring, especially in traditional IT operations environments. It is often considered by teams with established processes, mixed hardware estates, and a preference for proven tooling.
Its biggest strength is breadth in classic infrastructure monitoring. It can work well when the environment is network-heavy or when teams already have experience with SolarWinds products. The drawback is that it may feel less natural than newer platforms in fast-moving cloud-native environments. It is best suited to teams that still operate substantial traditional infrastructure and want a stable enterprise toolset.
New Relic: Best for teams combining infrastructure monitoring with observability
New Relic is a good fit for organizations that do not want infrastructure monitoring to sit in a separate operational silo. It is particularly useful for teams that want infrastructure, application telemetry, logs, and incident workflows connected in one platform.
The advantage is convergence. If your incidents often span infrastructure and application behavior, New Relic can help reduce the handoff friction between IT operations and engineering teams. The tradeoff is that some users looking for straightforward infrastructure-first monitoring may find the platform broader than they need.
Prometheus + Grafana: Best for Kubernetes and engineering-led teams
Prometheus with Grafana is one of the most common monitoring stacks in cloud-native and containerized environments. It is especially effective for teams that want deep control over metrics collection, dashboards, and alerting logic.
Its biggest strength is flexibility in dynamic environments, especially Kubernetes. It works well for technically strong teams that are comfortable building and maintaining parts of their own monitoring stack. The downside is that it is rarely the easiest option for organizations that want an out-of-the-box, executive-friendly, low-maintenance experience.
Dynatrace: Best for AI-assisted root cause analysis
Dynatrace is built for organizations that want deep automation, dependency mapping, and intelligent analysis layered into monitoring. It is often attractive for complex enterprise environments where incident investigation is expensive and downtime has a high operational cost.
Its strength is automation and context. The platform can help teams move faster from alert to diagnosis, especially in large distributed estates. Its limitation is that it can feel like more platform than smaller teams need, and the investment only makes sense when the organization is ready to use its advanced capabilities fully.
How to Choose the Right Monitoring Tool for Your Infrastructure
The smartest way to evaluate infrastructure monitoring tools is to start with your environment, not the vendor demo.
First, look at deployment reality. Are you monitoring on-prem systems, public cloud resources, branch networks, containers, or a mix of all of them? If the answer is hybrid, your decision should account for integration depth, dependency visibility, and operational consistency across environments.
Second, think about operational burden. Some tools are easier to deploy but cost more over time. Others save on licensing but demand greater in-house expertise. That tradeoff matters even more if your team is also responsible for governance, resilience, and security. In regulated or distributed environments, the monitoring conversation often needs to align with broader topics such as infrastructure security in cloud computing and whether your organization should rely on internal teams alone or engage IT infrastructure management services for part of the operating model.
Finally, evaluate pricing with scale in mind. A tool that looks affordable at 50 hosts may become a very different budget decision at 500.
Common Mistakes When Evaluating Infrastructure Monitoring Tools
One of the biggest mistakes is choosing a monitoring platform based on popularity instead of fit. The best tool for a cloud-native SaaS company is not automatically the best tool for a regional enterprise with mixed legacy and modern workloads.
Another mistake is ignoring growth. Monitoring needs change fast as environments expand, making IT infrastructure capacity planning part of the evaluation, not an afterthought. Teams also underestimate implementation effort, especially when they pick flexible tools without the internal skills to maintain them well.
A third mistake is treating monitoring as a standalone buying decision. In reality, it sits inside larger infrastructure design choices, including resilience, security, architecture, and budget discipline. That is why infrastructure leaders often pair monitoring planning with broader guidance on how to build a cloud computing infrastructure without wrecking your budget or security.
When Infrastructure Monitoring Alone Is Not Enough
Monitoring tells you when something is wrong or trending in the wrong direction. It does not, by itself, guarantee resilience, compliance, or recovery.
If your business depends on fast recovery from outages, monitoring should be paired with a real backup and recovery strategy. That is where planning around backup and disaster recovery and more specific disaster recovery solutions becomes essential.
Likewise, if your organization is rethinking platform design, migration, or private cloud options, a monitoring decision may lead into broader architectural questions. In some cases, teams discover they also need managed vs cloud services guidance or a clearer view of private cloud hosting services before a monitoring platform can deliver its full value.
How Accrets Can Help You Build a Monitoring-Ready Infrastructure
Once you know what kind of monitoring your environment needs, the next question is whether the underlying infrastructure is ready to support it well. That is where Accrets can help.
For organizations running complex or evolving environments, Accrets supports infrastructure modernization, hybrid architecture planning, managed operations, and resilience strategy through its IT Infrastructure solutions and Managed IT Services offerings. If your monitoring decision is part of a broader cloud operating model, Accrets also provides Cloud Infrastructure as a Service and IT DR as a Service for teams that need stronger operational resilience.
The goal is not just to install another tool. It is to create an infrastructure foundation where monitoring, governance, uptime, and recovery all work together.
Talk to an Accrets Cloud Expert
If you are evaluating the best tools for IT infrastructure monitoring and want guidance based on your actual environment, you can fill out the form for a free consultation with an Accrets Cloud Expert.
This is especially useful if you are comparing tools for hybrid infrastructure, modernizing legacy systems, improving visibility across cloud and on-prem environments, or aligning monitoring with backup, disaster recovery, and managed service goals.
Dandy Pradana is an Digital Marketer and tech enthusiast focused on driving digital growth through smart infrastructure and automation. Aligned with Accrets’ mission, he bridges marketing strategy and cloud technology to help businesses scale securely and efficiently.